Link to SPM: https://www.ipcc.ch/report/sixth-assessment-report-working-group-i/
IPCC Press Conference and Release of Report, live at 10AM CEST:
https://www.youtube.com/watch?v=z149vLKn9d8&ab_channel=IntergovernmentalPanelonClimateChange%28IPCC%29
The IPCC on Friday, August 6 approved the Summary for Policy Makers (SPM) of the Sixth Assessment (AR6), Working Group I Report (WGI), on the Physical Science of climate change, including observations and projections in cryosphere regions. The SPM was released today, August 9 at 10AM CEST (links above); the full Report on which it is based will be posted later.
This is the first of three parts of the Sixth Assessment: the second (on Impacts, Adaptation and Vulnerability) is scheduled for release in February 2022; and the third (covering Mitigation) in March 2022. A Synthesis Report, covering all three sections will then be released in September 2022.
The SPM contains four sections: the current state of the climate; future projections; risk assessment from these projections and needed adaptation; and the potential to limit warming through emissions reductions, as well as carbon dioxide removal (CDR).
It is worth emphasizing that IPCC reports do not comprise “new” science. Instead, they summarize existing science that has been accepted for publication, in this case as of January 31, 2021. In turn, IPCC SPMs focus on the strongest science that is most relevant for policy makers.
It is significant that this SPM includes several projections for potentially extreme impacts from the cryosphere, impacts that are irreversible for centuries or thousands of years. These projections, especially those regarding potential sea-level rise from ice sheets, may have been included in past in the main body of the Assessment (read by few policy makers), but not the SPM. For example, this SPM, for the first time, extensively notes sea-level rise (SLR) projections well beyond 2100, important because this is a delayed, but irreversible, consequence of global heating that would only begin to manifest itself by 2100.
Although the SPM did not make a specific connection, it includes extensive coverage of extreme weather events (droughts, floods, wildfires) that may be connected to polar amplification, the greater warming especially occurring over the Arctic.
Arctic sea ice, glacier loss, decrease in snow cover, Greenland ice loss and ocean acidification, warming, and oxygen loss were cited throughout the SPM as among the most certain and severe impacts of greenhouse gas (GHG) emissions to-date, with ice sheet loss and SLR as the most threatening for the future, especially under high emissions scenarios.
Permafrost thaw was noted as a clear impact, but significantly, the SPM did not include estimates of future thaw and related emissions, noting that the underlying models did not include this feedback.
Other AR6 SPM highlights, especially as relate to cryosphere dynamics:
Loss of Ice Sheets and SLR More Rapid and Potentially Extreme Under Highest Emissions:
Greenland and Antarctic Ice Sheet loss will continue, with understanding of Greenland dynamics greater than Antarctica. Total ice loss from the Greenland Ice Sheet will increase with the level of emissions. For Antarctica, extreme rates of ice loss (resulting from ice sheet instability processes that remain poorly understood, potentially involving tipping points) cannot be ruled out. Such extreme loss from the Antarctic Ice Sheet would continue for centuries under very high GHG emissions scenarios (see below for a description of the five new scenarios), and could lead to 2 meters global mean SLR by 2100, and 5 meters by 2150.
SLR projections otherwise included: by 2100, 0.28-0.55m under very low GHG emissions scenarios, versus 0.44-0.76m for intermediate emissions, and 0.63-1.01m under very high emissions. Already by 2150 however, even greater differences emerge, with 0.37-0.86m under the very low scenario, and 0.98-1.88m under very high scenarios; but again, up to 5m could not be ruled out already by 2150 under high emissions.
On even longer time scales however, sea level is committed to rise for centuries to millennia due to continuing deep ocean warming and ice sheet melt, and will remain elevated for thousands of years. Over the next 2000 years, global mean sea level will rise by about 2m to 3m if warming is limited to 1.5°C, and by 2m to 6m if limited to 2°C. However, with high emissions resulting in 5°C of warming, 19m to 22m will occur in the next 2000 years; and it will continue to rise over subsequent millennia. The SPM notes that these projections of multi-millennial global SLR are consistent with what we know from the geologic record of past warm climate periods: 5m–10m higher than today around 125,000 years ago, when global temperatures were 0.5°C–1.5°C above pre-industrial; and 5m–25m higher roughly 3 million years ago, when global temperatures were 2.5°C–4°C above pre-industrial.
In terms of observations to-date, global mean sea level increased by 0.20m between 1901 and 2018. The average rate was 1.3mm/yr between 1901 and 1971; increasing to 1.9 mm/yr between 1971 and 2006; and further increasing to 3.7mm/yr between 2006 and 2018. Ice sheets and glaciers were the main contributors to SLR after 2006, surpassing thermal expansion. Extreme coastal flooding that occurred only once per century in the recent past is projected to occur at least annually at more than half of all tide gauge locations by 2100.
Glaciers and Snow Clearly Decreasing Worldwide:
Virtually all glaciers in the world have been receding simultaneously with current warming, and losses are committed to continue for decades to centuries, depending on future emissions. Between 1971 and 2018, glaciers contributed more to sea level rise than the polar ice sheets. Snow cover and snowpack also has decreased throughout the world. Heavy precipitation is one of the weather impacts projected to increase in most regions; but the degree of future heavy snowfall events was less certain.
Loss of snow and glaciers will be higher at 2°C warming or above, than at 1.5°C.
Clear Arctic Sea Ice Loss:
The Arctic would be practically sea ice free in September at least once before 2050 under even very low emissions scenarios, with more frequent occurrences for higher warming levels. Loss of Arctic sea ice, as well as freshwater lake ice will continue, with losses greater at 2°C global warming or above than at 1.5°C.
The SPM did not note a threshold global mean temperature for frequent September ice-free conditions, nor the frequency of ice-free conditions at different emissions and temperature levels, as it did in the SR1.5 and SROCC; though annual ice-free conditions in September has been noted in the literature as occurring at around 1.7°C of warming, with such conditions increasing in length as temperatures rise.
(Polar) Ocean Acidification, Warming and Oxygen Loss:
The report did not specifically address polar or high latitude ocean regions, aside from sea ice. It did note that the frequency of marine heatwaves has doubled since the 1980’s, and that today’s growing acidification processes appear “unusual“ in the past 2 million years. With continued emissions, ocean pH levels seem headed towards conditions not present since a far slower acidification event 50 million years ago.
GHG emissions since 1750 already have committed the global ocean to extensive future warming. Through 2100, additional ocean warming ranges from 2x–4x (even with low emissions) that of warming over the past 40 years, but 4x–8x will occur with high emissions. Ocean acidification and deoxygenation are set to increase given emissions to-date, but at rates and extent dependent on future emissions. Changes in global ocean temperature, deep ocean acidification and deoxygenation are irreversible on centennial to millennial time scales. (ICCI Note: Observations show that these factors, in particular acidification are greatest in the Southern and Arctic Oceans, and other high-latitude waters such as the Beaufort and Barents seas.)
Permafrost Thaw and Emissions:
The report noted anticipated greater permafrost thaw with higher emissions and temperatures, and that loss of permafrost carbon following thaw is irreversible at centennial timescales. Loss of permafrost is projected to continue as temperatures increase, with loss greater at 2°C global warming or above than at 1.5°C.
Although projecting “larger” thaw and loss as temperatures reach or surpass 2°C, the SPM did not give an estimate of permafrost emissions or future loss under different emissions levels (though it is likely the underlying main report does so). It did note however that increased emissions of both CO2 and methane from permafrost thaw, wetland and wildfires would occur with high CO2 emissions scenarios and temperatures. The new emissions scenarios included in AR6 (see below) do not include these potential feedbacks, which would decrease the amount of CO2 which humans can emit and remain within, or close to 1.5°C of warming.
Benefits of Emissions Reductions:
CO2 levels are now at their highest in at least 2 million years, with methane at its highest in at least 800,000 years. Temperatures of the past decade were last this warm 125,000 years ago.
Many impacts, especially from cryosphere will continue for centuries to millennia; but the SPM made clear that low and very low levels of emissions reductions would have a detectable impact in the near term, beginning around 2040; and decrease the severity and extent of severe damaging climate events compared to continued high and very high emissions. These include the frequency of extreme coastal flooding, heavy precipitation and related flooding, and dangerous heatwaves; while also limiting the regions where these occur.
CO2 removal (CDR) leading to global net negative emissions would lower atmospheric CO2 concentrations, and reverse continued surface ocean acidification. If global net negative CO2 emissions were achieved and sustained, the global temperature increase caused by past CO2 emissions would gradually be reversed; though other climate changes would continue in their current direction for decades to millennia. For instance, it would take several centuries to millennia to halt, and then reverse SLR from ice sheet and glacier loss, even with large net negative CO2 emissions (presumably as ice sheet re-growth is an extremely slow process due to persistent ocean warming; and even glacier re-growth takes centuries, although the SPM did not note this). Low and very low emissions pathways would decrease the amount of CDR necessary, and the SPM notes that some CDR methods can negatively impact water availability, food production and biodiversity.
Final Note: the New Emissions Scenarios:
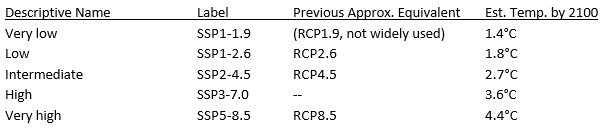
Readers of the Cryosphere Capsules will likely be familiar with the RCPs (“Representative Concentration Pathways”) of future possible emissions used in previous IPCC Reports. AR6 introduces a new set, and it is best to learn them as they will be used in nearly all future model research! Below are the main scenarios used in the AR5 WGI SPM, well as their previous equivalents, as appropriate:
By Science Writing Intern Haily Landrigan, Global Outreach Director Amy Imdieke, and ICCI Director Pam Pearson.
Published Aug. 9, 2021 Updated Jul. 12, 2022 3:25 pm